A delay in decision-making can cost businesses time, money, and resources. It pushes back project timelines and creates operational hurdles. Real-time analytics enables your teams to make fast, informed decisions. However, real-time analytics are of little practical use if the data presented isn’t relevant. Our analytics platforms, Kollective IQ and Kollective Free Analytics, supply data that has recency and relevance giving your data meaning and allowing you to quickly make actionable insights that solve problems and drive your business forward!
What are Real-Time Analytics?
Real-time analytics allow users to view and analyze data immediately after entering a system. This may sound simple, but there’s a lot that goes into providing live telemetry. Our developers use logic and algorithms to quickly serve your data into dashboards that are dynamically updated as data continues to stream in.
Why are Real-Time Analytics Important?
With real-time analytics, businesses can identify and respond to problems as they develop, gaining valuable insights and preventing costly delays. Other benefits of real-time analytics include:
- Instant Insights
- Operational Agility
- Process Refinement
- Better Decision Making
- Lower Costs
Tracking Employee Engagement with Real-Time Analytics
To see how real-time analytics will add value to your communications strategy, let’s explore a practical example.
Keeping employees engaged has been a business concern long before the pandemic began. Hybrid work is here to stay, it is more important than ever before that critical communications are received across dispersed workforces.
With other analytics platforms – like those provided natively with Microsoft Teams – users can only download attendance reports after an event ends. This is typically presented as raw data that needs to be processed and formatted before it can be analyzed. Kollective IQ and Free Analytics deliver key metrics in user-friendly dashboards that can be viewed live as your event runs or later at your own convenience.
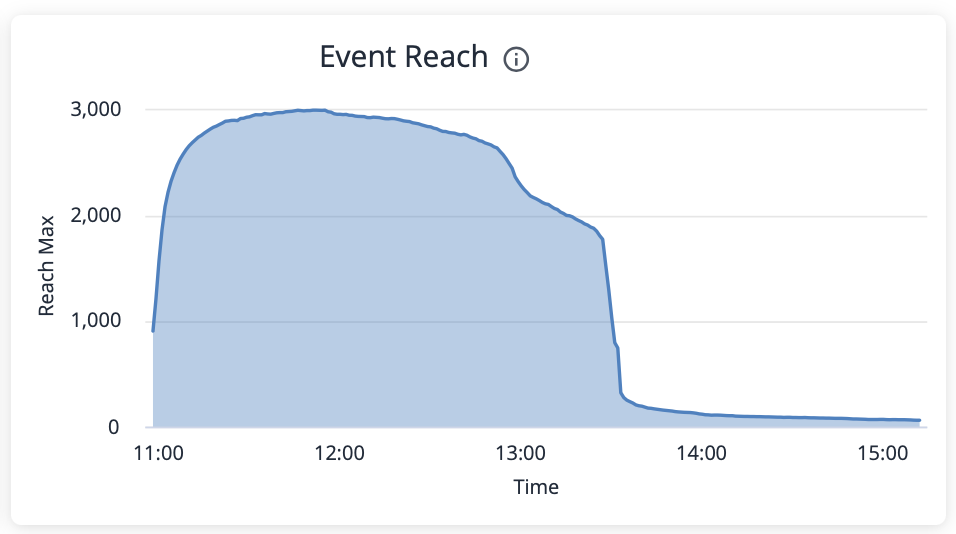
The event reach graph (above) allows us to see how attendance and engagement fluctuates during a video event. In the example below, we see attendance drop off at several points before the event ends. There’s a slight decline in attendance after one hour and a sharp decline after two hours. This may or may not be concerning but, most importantly, it allows you to quickly place it in context with your event expectations to determine whether there are potential issues that need to be resolved and if your messaging has been received by all personnel.
Supercharge Your Video Events with Kollective’s Real-Time Analytics
Bolster your video communications strategy by adding one of Kollective’s advanced analytics to your tech stack. Visualize employee engagement and network performance to make impactful adjustments in real time. To learn more, stay tuned for our next article in this series on performance monitoring in real time.