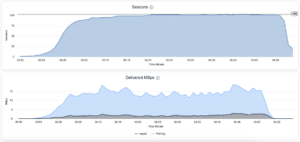
What is a time series?
At Kollective, we're big fans of time series data. A time series provides a clear view of how a particular metric changes over time. For instance, our Location Performance dashboard features several time series visualizations that allow users to see not only what happened during an event but also precisely when it occurred. When multiple time series share the same time scale, they can also reveal relationships between different metrics.
A time series can be structured on any time scale, as long as it suits your data. In the Location Performance dashboard, for example, we display data in minutes, which makes sense given the event-specific focus.

Kollective's Observability data is presented in 5-minute, 1-hour, or 1-day intervals, depending on how you zoom in on the data.
Here's an example of 5-minute data points:

1-hour data points:

And 1-day data points:

On the other end of the spectrum, our trend dashboards display information by month, which is more appropriate for analyzing long-term trends.

Benefits of Time Series Data
Why are we so enthusiastic about time series data? Because time series visualizations are intuitive and easy to interpret, making them an excellent tool for understanding complex datasets. They allow you to answer unique questions that would be difficult to resolve otherwise. Here are some examples of questions that only time series data can answer:
-
During an event, a particular location had a lower-than-average Transfer Success Rate with some higher transfer times. Was there latency throughout the event, or did network saturation occur partway through?
-
How many events did my company run each month over the past two years?
-
Did transfer latency or failures lead to stalls and negatively impact the quality of the user experience?
These are just a few possibilities—time series data offers countless insights to explore.
One important point to consider, especially when correlating metrics, is that time series data can suggest relationships between metrics, as in the example of transfer latency and failures. However, both metrics might be symptoms of a separate underlying issue, rather than directly causing changes in each other. It's crucial to remember the common adage: "Correlation does not imply causation."
Challenges of Time Series Data
While time series data is incredibly valuable, it also presents some challenges.
Firstly, time series datasets can be massive, especially when data is collected at minute or hourly intervals. This data needs to be aggregated by the minute, hour, day, or month, depending on the timeframe. The sheer volume of data involved requires significant processing and storage capacity, which is why we only retain time series data for 90 days.
Another challenge is ensuring that every time point is accounted for in calculations or visualizations. For example, if you're analyzing hourly data over a week and your company ran two 1-hour events, you'd have only two points of actual data. However, to create a complete time series, you'd need to fill in the remaining hours with zeros, resulting in 168 data points—one for each hour of the week—even though only two contain non-zero values.
Conclusion
In conclusion, time series data is an invaluable tool for understanding how metrics evolve over time, making it a cornerstone of data analysis at Kollective. Whether it's tracking the performance of an event minute by minute or analyzing long-term trends across months, time series visualizations provide clear, actionable insights that are easy to interpret. They enable us to answer complex questions and reveal relationships between different metrics. By carefully analyzing this data, we can uncover patterns and anomalies that help improve network performance and user experience, making time series an essential part of our analytical toolkit.
Discover How Kollective Observability Can Benefit Your Business
Schedule a demo of Kollective's Video Assurance Platform today to experience firsthand how you can improve the experience of every user in your organization.
 Cliente